Predicting flood risks in a Toronto neighbourhood in the 21st century
Tags:
On August 7, 2018, more than 70mm of rain fell on Toronto during an unanticipated and highly localized ‘ninja’ storm. Lasting only two hours, the ensuing flood overwhelmed parts of the city, causing power outages, disruption to public transport and destruction of property estimated at over $80 million in damages by the Insurance Bureau of Canada.
In particular, the flood-prone region of Rockcliffe, situated between the Humber River and the Black Creek, was heavily impacted, as it was during the flood of 2013, and again during storms in the summers of 2019 and 2020.
According to a study published in January in Water by researchers at the Lassonde School of Engineering at York University, annual rainfall intensities in Rockcliffe are projected to increase during the latter part of 21st century, likely leading to greater damage, economic costs and social impacts.
“We studied the flood risk of the Rockcliffe-Smythe neighbourhood in Toronto under future rainfall scenarios”, explains study co-author Professor Usman T. Khan (Civil Engineering at Lassonde). The Toronto Region Conservation Authority (TRCA) identifies Rockcliffe as a particularly flood-vulnerable area, being situated downstream from the larger Black Creek and Humber River watersheds. Watersheds are areas of land that catch rain and snow before it drains into a body of water like the Black Creek. Urban development, such as found in Rockcliffe, tends to exacerbate the risk of flooding because roofs, pavements and roads prevent rain from being absorbed into the ground, which would have lessened the water run-off flowing directly to Black Creek.
One of the first steps in their study was to assess nearly twenty different flood risk models. The problem is that many of these models use deterministic methods to make predictions which ignores the variability we see during rainfall events. “Rainfall is dynamic, spatially and temporally, and this means that the location and duration of rainfall events is very variable. A probabilistic, or stochastic method was necessary,” explains Professor Khan. “If rainfall is heavy at one location or another, how does it impact where it floods?” Stochastic methods run thousands of simulations that factor in ranges of values and probabilities of occurrences to draw a conclusion.
In addition to strictly historical meteorological data, the researchers incorporated climate change scenarios to predict what we might see in the future. These scenarios are called the Representative Concentration Pathways (RCPs) and model the trajectory of greenhouse gas (GHG) concentrations expected by the year 2100. For example, RCP 2.6 which assumes that solar flux increases by only 2.6 W/m2, is an optimistic scenario that limits global warming to 2°C. However, in RCP 8.5 (8.5 W/m2), GHGs rise unabated in what is considered both the worst-case scenario and business-as-usual, causing the Earth’s temperature to rise by over 4°C. The team assessed flood scenarios from 2020 all the way up to 2099, and found that in the long-term, all RCPs show higher annual rainfall than the historically observed 800 mm/year, with RCP 8.5 representing the worst outcome with 1300 mm/year of expected precipitation.
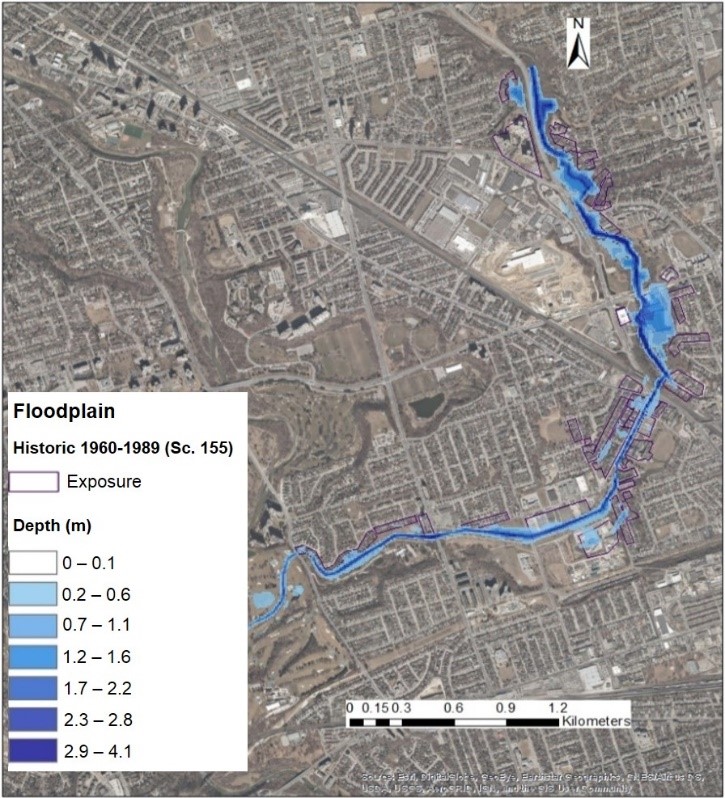
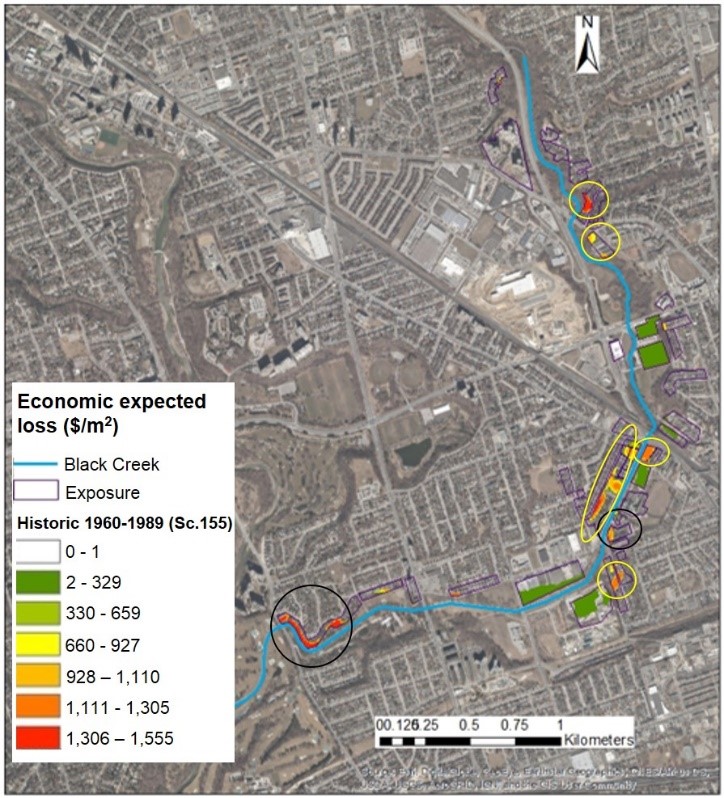
From rainfall predictions, the team used their stochastic framework to pinpoint locations of flood risk within Rockcliffe and quantified the outcomes of floods in terms of social and economic effects; the number of people affected and the cost of expected damages to office, industrial and residential buildings. To verify their model, they ran an analysis on historical data from 1960-1989 and compared it to a separate study by the TRCA. “We projected over $8M in damages and the TRCA value was essentially the same using a completely different approach,” explains Professor Khan. From this research, organizations like the TRCA will be able to look at generated flood and economic loss maps to determine where intervention is needed and understand who is at risk. “Ultimately, this framework helps conservation authorities make better informed decisions.”
The work was not without challenges. The stochastic approach had not been used before in flood risk forecasting and had to be adapted from earthquake research. Then, there was issue of combining meteorological, hydrological, hydraulic, economic and census data. “When you’re running so many different scenarios, it’s very data-intensive,” says Professor Khan, “finding suitable and publicly accessible data, running simulations for days, and then trying to make sense of it all.” To meet these challenges, the research was also highly collaborative, bringing together experts in flood forecasting and in climate change extreme events, from nearby McMaster University to the Netherlands.
Professor Khan and his team will continue improving their forecasting by building in population growth, as population size and even the state of urbanization are fixed inputs in their current model. “As the city gets denser over time with an increasing number of people living here, that will affect flood risk,” says Professor Khan. At the moment, they are also engaging with the province to extend this work to Southern Ontario. “This was just one watershed. We’re going to do something similar to dozens of watersheds.”