Decoding the eye: Lassonde research helps unravel the complexities of our visual system
Tags:
Whether we are admiring a beautiful landscape or watching an action-packed movie, our visual system is hard at work performing intricate, biological functions that allow us to process and respond to visual information.
Understanding the intricacies of the visual system is key to advancing research in biology, biomedicine and computer vision. Moreover, this understanding can aid in developing strategies to address visual impairments in humans. That is why Andrew Eckford and Gene Cheung, associate professors in the Electrical Engineering & Computer Science department at the Lassonde School of Engineering, are developing a tool that can interpret the activity of cells involved in visual processes, enhancing our understanding of this complex biological system.
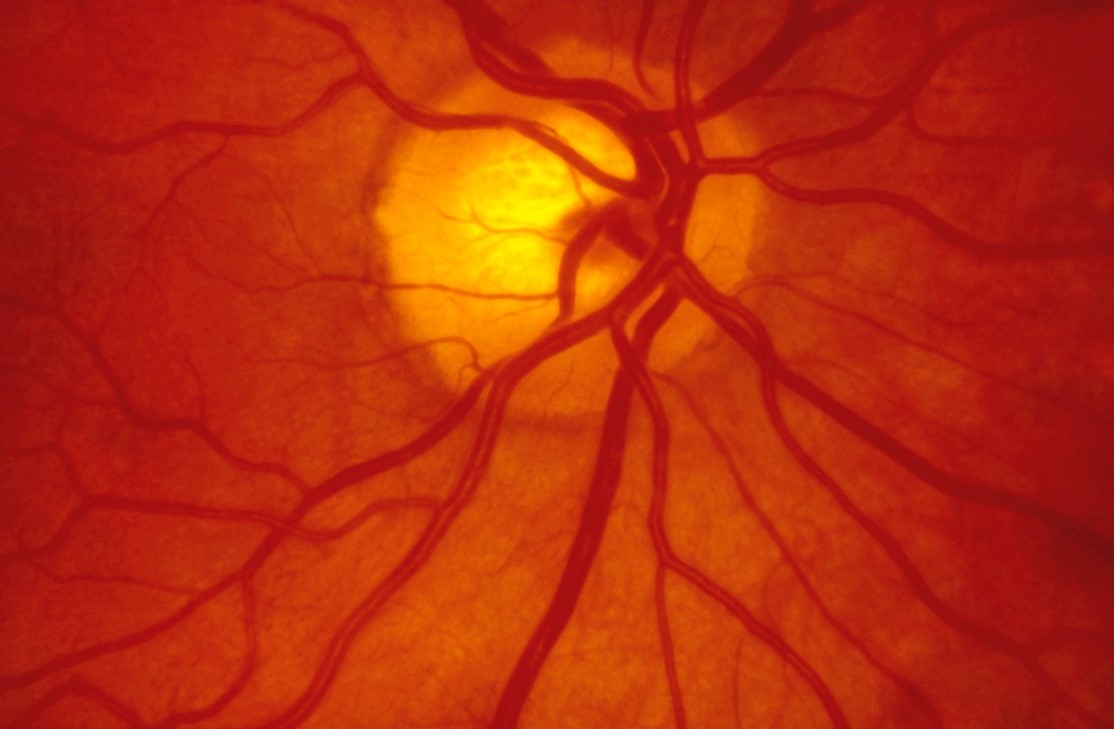
This research is focused on nerve tissue behind the eye known as the retina. The retina is responsible for receiving images and sending them to the brain for processing using ganglion cells.
Many researchers have hypothesized that each ganglion cell type is responsible for computing specific features in a visual scene. For example, some cells may focus on information about the texture of an object, while others may process movement in a particular direction.
“From a big picture perspective, we are trying to gain a better understanding of the visual system and how the eye processes information,” says Professor Eckford. “We developed a tool that can analyze a data set of ganglion cell activity and identify relationships and patterns to predict exactly what the eye is looking at.”
Professors Eckford and Cheung and their graduate student, Yasaman Parhizkar, proposed a graph-based tool that uses mathematical operations to discover patterns within a dataset and make useful predictions about trends among the data points.
The proposed tool was tested using visual data gathered from a quirky experiment led by University of Chicago Professor Stephanie Palmer.
During the experiment, a visually-satisfying film about an aquatic environment was projected onto the retinas of salamanders. The scenes resembled their natural habitat – imagine cool waters, sea plants and the occasional swimming fish.
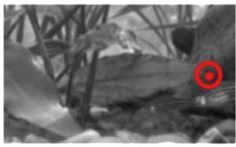
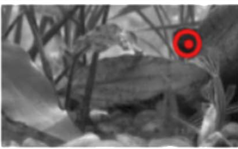
Movie frames of aquatic environments and focal points.
As the film played, data concerning the salamanders’ ganglion cell activity was collected. The graph-based tool was used to identify and interpret trends within the dataset and link these patterns to specific visual features in the film.
“It’s really cool to be able to take a data set of cell activity and see if we can predict exactly what the eye is looking at,” says Professor Eckford.
Not only did the tool exhibit the capacity to interpret patterns within the dataset and make useful predictions, but it also surpassed the abilities of comparable algorithms.
“Our tool addressed many of the problems that other algorithms have,” says Parhizkar. “Ours is much more interpretable and less data hungry.”
The applications of this unique tool can also be extended far beyond the field of biology, to industries such as agriculture, for making predictions about crop yield.
Learn more about this work in Professor Eckford, Professor Cheung and Parhizkar’s recent publication.